

TiDB从2.1.8开始,information_schema中包含了SLOW_QUERY表。SLOW_QUERY 表中提供了慢查询相关的信息,其内容通过解析 TiDB 慢查询日志而来,列名和慢日志中的字段名是一一对应。对于慢日志的解析,有很多实现的方法。那我们今天就来看看 TiDB 中慢日志解析是怎么实现的吧。
Slow_query定义
TiDB 会将执行时间超过 slow-threshold(默认值为 300 毫秒)的语句输出到 slow-query-file(默认值:”tidb-slow.log”)日志文件中,用于帮助用户定位慢查询语句,分析和解决 SQL 执行的性能问题。
从3.0.5开始,TiDB慢日志中引入了执行计划相关信息,故slow_query的定义也发生了变化,具体如下:
var slowQueryCols = []columnInfo{
    {variable.SlowLogTimeStr, mysql.TypeTimestamp, 26, 0, nil, nil},
	{variable.SlowLogTxnStartTSStr, mysql.TypeLonglong, 20, mysql.UnsignedFlag, nil, nil},
	{variable.SlowLogUserStr, mysql.TypeVarchar, 64, 0, nil, nil},
	{variable.SlowLogHostStr, mysql.TypeVarchar, 64, 0, nil, nil},
	{variable.SlowLogConnIDStr, mysql.TypeLonglong, 20, mysql.UnsignedFlag, nil, nil},
	{variable.SlowLogQueryTimeStr, mysql.TypeDouble, 22, 0, nil, nil},
	{execdetails.ProcessTimeStr, mysql.TypeDouble, 22, 0, nil, nil},
	{execdetails.WaitTimeStr, mysql.TypeDouble, 22, 0, nil, nil},
	{execdetails.BackoffTimeStr, mysql.TypeDouble, 22, 0, nil, nil},
	{execdetails.RequestCountStr, mysql.TypeLonglong, 20, mysql.UnsignedFlag, nil, nil},
	{execdetails.TotalKeysStr, mysql.TypeLonglong, 20, mysql.UnsignedFlag, nil, nil},
	{execdetails.ProcessKeysStr, mysql.TypeLonglong, 20, mysql.UnsignedFlag, nil, nil},
	{variable.SlowLogDBStr, mysql.TypeVarchar, 64, 0, nil, nil},
	{variable.SlowLogIndexNamesStr, mysql.TypeVarchar, 100, 0, nil, nil},
	{variable.SlowLogIsInternalStr, mysql.TypeTiny, 1, 0, nil, nil},
	{variable.SlowLogDigestStr, mysql.TypeVarchar, 64, 0, nil, nil},
	{variable.SlowLogStatsInfoStr, mysql.TypeVarchar, 512, 0, nil, nil},
	{variable.SlowLogCopProcAvg, mysql.TypeDouble, 22, 0, nil, nil},
	{variable.SlowLogCopProcP90, mysql.TypeDouble, 22, 0, nil, nil},
	{variable.SlowLogCopProcMax, mysql.TypeDouble, 22, 0, nil, nil},
	{variable.SlowLogCopProcAddr, mysql.TypeVarchar, 64, 0, nil, nil},
	{variable.SlowLogCopWaitAvg, mysql.TypeDouble, 22, 0, nil, nil},
	{variable.SlowLogCopWaitP90, mysql.TypeDouble, 22, 0, nil, nil},
	{variable.SlowLogCopWaitMax, mysql.TypeDouble, 22, 0, nil, nil},
	{variable.SlowLogCopWaitAddr, mysql.TypeVarchar, 64, 0, nil, nil},
	{variable.SlowLogMemMax, mysql.TypeLonglong, 20, 0, nil, nil},
	{variable.SlowLogSucc, mysql.TypeTiny, 1, 0, nil, nil},
	{variable.SlowLogPlan, mysql.TypeLongBlob, types.UnspecifiedLength, 0, nil, nil},
	{variable.SlowLogPrevStmt, mysql.TypeLongBlob, types.UnspecifiedLength, 0, nil, nil},
	{variable.SlowLogQuerySQLStr, mysql.TypeLongBlob, types.UnspecifiedLength, 0, nil, nil},
}
较之前版本,增加了SlowLogPlan,用以存储执行计划。
Slow Query 字段含义说明
根据官方文档,一些 Slow Query 的基础字段含义如下:
注意:
慢查询日志中所有时间相关字段的单位都是 “秒”
Slow Query 基础信息:
Time:表示日志打印时间。Query_time:表示执行这个语句花费的时间。Query:表示 SQL 语句。慢日志里面不会打印Query,但映射到内存表后,对应的字段叫Query。Digest:表示 SQL 语句的指纹。Txn_start_ts:表示事务的开始时间戳,也是事务的唯一 ID,可以用这个值在 TiDB 日志中查找事务相关的其他日志。Is_internal:表示是否为 TiDB 内部的 SQL 语句。true表示 TiDB 系统内部执行的 SQL 语句,false表示用户执行的 SQL 语句。Index_ids:表示语句涉及到的索引的 ID。Succ:表示语句是否执行成功。Backoff_time:表示语句遇到需要重试的错误时在重试前等待的时间,常见的需要重试的错误有以下几种:遇到了 lock、Region 分裂、tikv server is busy。
和内存使用相关的字段:
Memory_max:表示执行期间 TiDB 使用的最大内存空间,单位为 byte。
和 SQL 执行的用户相关的字段:
User:表示执行语句的用户名。Conn_ID:表示用户的链接 ID,可以用类似con:3的关键字在 TiDB 日志中查找该链接相关的其他日志。DB:表示执行语句时使用的 database。
和 TiKV Coprocessor Task 相关的字段:
Request_count:表示这个语句发送的 Coprocessor 请求的数量。Total_keys:表示 Coprocessor 扫过的 key 的数量。Process_time:执行 SQL 在 TiKV 的处理时间之和,因为数据会并行的发到 TiKV 执行,这个值可能会超过Query_time。Wait_time:表示这个语句在 TiKV 的等待时间之和,因为 TiKV 的 Coprocessor 线程数是有限的,当所有的 Coprocessor 线程都在工作的时候,请求会排队;当队列中有某些请求耗时很长的时候,后面的请求的等待时间都会增加。Process_keys:表示 Coprocessor 处理的 key 的数量。相比 total_keys,processed_keys 不包含 MVCC 的旧版本。如果 processed_keys 和 total_keys 相差很大,说明旧版本比较多。Cop_proc_avg:cop-task 的平均执行时间。Cop_proc_p90:cop-task 的 P90 分位执行时间。Cop_proc_max:cop-task 的最大执行时间。Cop_proc_addr:执行时间最长的 cop-task 所在地址。Cop_wait_avg:cop-task 的平均等待时间。Cop_wait_p90:cop-task 的 P90 分位等待时间。Cop_wait_max:cop-task 的最大等待时间。Cop_wait_addr:等待时间最长的 cop-task 所在地址。
读取慢日志文件
官方文档中提到不支持多多个慢日志文件的的解析,从源码中可以很直观的看出的。
// parseSlowLogFile uses to parse slow log file.
// TODO: Support parse multiple log-files.
func parseSlowLogFile(tz *time.Location, filePath string) ([][]types.Datum, error) {
	file, err := os.Open(filePath)
	if err != nil {
		return nil, errors.Trace(err)
	}
	defer func() {
		if err = file.Close(); err != nil {
			logutil.Logger(context.Background()).Error("close slow log file failed.", zap.String("file", filePath), zap.Error(err))
		}
	}()
	return ParseSlowLog(tz, bufio.NewReader(file))
}

// ParseSlowLog exports for testing.
// TODO: optimize for parse huge log-file.
func ParseSlowLog(tz *time.Location, reader *bufio.Reader) ([][]types.Datum, error) {
	var rows [][]types.Datum
	startFlag := false
	var st *slowQueryTuple
	for {
		lineByte, err := getOneLine(reader)
		if err != nil {
			if err == io.EOF {
				return rows, nil
			}
			return rows, err
		}
另外,官方文档提到TiDB 通过 session 变量 tidb_slow_query_file 控制查询 INFORMATION_SCHEMA.SLOW_QUERY 时要读取和解析的文件,可通过修改改 session 变量的值来查询其他慢查询日志文件的内容:
set tidb_slow_query_file = "/path-to-log/tidb-slow.log"
慢日志解析时,获取session的信息如下:
func dataForSlowLog(ctx sessionctx.Context) ([][]types.Datum, error) {
	return parseSlowLogFile(ctx.GetSessionVars().Location(), ctx.GetSessionVars().SlowQueryFile)
}
慢日志的解析过程
1.判断是不是慢日志的开始
line := string(hack.String(lineByte))
		// Check slow log entry start flag.
		if !startFlag && strings.HasPrefix(line, variable.SlowLogStartPrefixStr) {
			st = &slowQueryTuple{}
			err = st.setFieldValue(tz, variable.SlowLogTimeStr, line[len(variable.SlowLogStartPrefixStr):])
			if err != nil {
				return rows, err
			}
			startFlag = true
			continue
		}
与filebeat类似,通过设定起始字符串,来判断慢日志的开始。使用setFieldValue可以将处理的信息赋值给对应的栏位,这块将在下面讲解。慢日志每行的起始值定义可以从sessionctx/variable/session.go中获取这些起始值的相关定义,SlowLogStartPrefixStr的定义是# Time: ,即慢日志的开始时间,也是慢日志开始的标志。
const (
	// SlowLogRowPrefixStr is slow log row prefix.
	SlowLogRowPrefixStr = "# "
	// SlowLogSpaceMarkStr is slow log space mark.
	SlowLogSpaceMarkStr = ": "
	// SlowLogSQLSuffixStr is slow log suffix.
	SlowLogSQLSuffixStr = ";"
	// SlowLogTimeStr is slow log field name.
	SlowLogTimeStr = "Time"
	// SlowLogStartPrefixStr is slow log start row prefix.
	SlowLogStartPrefixStr = SlowLogRowPrefixStr + SlowLogTimeStr + SlowLogSpaceMarkStr
	// SlowLogTxnStartTSStr is slow log field name.
	SlowLogTxnStartTSStr = "Txn_start_ts"
	// SlowLogUserStr is slow log field name.
	SlowLogUserStr = "User"
	// SlowLogHostStr only for slow_query table usage.
	SlowLogHostStr = "Host"
	// SlowLogConnIDStr is slow log field name.
	SlowLogConnIDStr = "Conn_ID"
	// SlowLogQueryTimeStr is slow log field name.
	SlowLogQueryTimeStr = "Query_time"
	// SlowLogParseTimeStr is the parse sql time.
	SlowLogParseTimeStr = "Parse_time"
	// SlowLogCompileTimeStr is the compile plan time.
	SlowLogCompileTimeStr = "Compile_time"
	// SlowLogDBStr is slow log field name.
	SlowLogDBStr = "DB"
	// SlowLogIsInternalStr is slow log field name.
	SlowLogIsInternalStr = "Is_internal"
	// SlowLogIndexNamesStr is slow log field name.
	SlowLogIndexNamesStr = "Index_names"
	// SlowLogDigestStr is slow log field name.
	SlowLogDigestStr = "Digest"
	// SlowLogQuerySQLStr is slow log field name.
	SlowLogQuerySQLStr = "Query" // use for slow log table, slow log will not print this field name but print sql directly.
	// SlowLogStatsInfoStr is plan stats info.
	SlowLogStatsInfoStr = "Stats"
	// SlowLogNumCopTasksStr is the number of cop-tasks.
	SlowLogNumCopTasksStr = "Num_cop_tasks"
	// SlowLogCopProcAvg is the average process time of all cop-tasks.
	SlowLogCopProcAvg = "Cop_proc_avg"
	// SlowLogCopProcP90 is the p90 process time of all cop-tasks.
	SlowLogCopProcP90 = "Cop_proc_p90"
	// SlowLogCopProcMax is the max process time of all cop-tasks.
	SlowLogCopProcMax = "Cop_proc_max"
	// SlowLogCopProcAddr is the address of TiKV where the cop-task which cost max process time run.
	SlowLogCopProcAddr = "Cop_proc_addr"
	// SlowLogCopWaitAvg is the average wait time of all cop-tasks.
	SlowLogCopWaitAvg = "Cop_wait_avg"
	// SlowLogCopWaitP90 is the p90 wait time of all cop-tasks.
	SlowLogCopWaitP90 = "Cop_wait_p90"
	// SlowLogCopWaitMax is the max wait time of all cop-tasks.
	SlowLogCopWaitMax = "Cop_wait_max"
	// SlowLogCopWaitAddr is the address of TiKV where the cop-task which cost wait process time run.
	SlowLogCopWaitAddr = "Cop_wait_addr"
	// SlowLogMemMax is the max number bytes of memory used in this statement.
	SlowLogMemMax = "Mem_max"
	// SlowLogPrepared is used to indicate whether this sql execute in prepare.
	SlowLogPrepared = "Prepared"
	// SlowLogHasMoreResults is used to indicate whether this sql has more following results.
	SlowLogHasMoreResults = "Has_more_results"
	// SlowLogSucc is used to indicate whether this sql execute successfully.
	SlowLogSucc = "Succ"
	// SlowLogPrevStmt is used to show the previous executed statement.
	SlowLogPrevStmt = "Prev_stmt"
	// SlowLogPlan is used to record the query plan.
	SlowLogPlan = "Plan"
	// SlowLogPlanPrefix is the prefix of the plan value.
	SlowLogPlanPrefix = ast.TiDBDecodePlan + "('"
	// SlowLogPlanSuffix is the suffix of the plan value.
	SlowLogPlanSuffix = "')"
	// SlowLogPrevStmtPrefix is the prefix of Prev_stmt in slow log file.
	SlowLogPrevStmtPrefix = SlowLogPrevStmt + SlowLogSpaceMarkStr
)
2.解析非SQL语句相关信息
if startFlag {
			// Parse slow log field.
			if strings.HasPrefix(line, variable.SlowLogRowPrefixStr) {
				line = line[len(variable.SlowLogRowPrefixStr):]
和判断慢日志开始逻辑类似,通过判断每行的起始信息,每行的起始标志为SlowLogRowPrefixStr的定义如下:
const (
	// SlowLogRowPrefixStr is slow log row prefix.
	SlowLogRowPrefixStr = "# “
2.1处理事务相关的信息
				if strings.HasPrefix(line, variable.SlowLogPrevStmtPrefix) {
					st.prevStmt = line[len(variable.SlowLogPrevStmtPrefix):]
				}
举个例子:
begin
Select * from test
Commit
当commit时,已经超过慢查询的时间,如果只记录commit,会造成分析慢日志时的困惑,到底是什么SQL引起的,通过记录相关的上一条事务来更好的分析慢日志。 对SlowLogPrevStmtPrefix定义如下:
const (
...
	// SlowLogSpaceMarkStr is slow log space mark.
	SlowLogSpaceMarkStr = ": "
	// SlowLogPrevStmt is used to show the previous executed statement.
	SlowLogPrevStmt = "Prev_stmt"
...
	// SlowLogPrevStmtPrefix is the prefix of Prev_stmt in slow log file.
	SlowLogPrevStmtPrefix = SlowLogPrevStmt + SlowLogSpaceMarkStr
)
2.2 处理慢日志中的其他非SQL语句信息
else {
					fieldValues := strings.Split(line, " ")
					for i := 0; i < len(fieldValues)-1; i += 2 {
						field := fieldValues[i]
						if strings.HasSuffix(field, ":") {
							field = field[:len(field)-1]
						}
						err = st.setFieldValue(tz, field, fieldValues[i+1])
						if err != nil {
							return rows, err
						}
					}
				}
			}
这时处理的是诸如执行时间、CPU耗时、DB等信息。
3.解析SQL语句相关信息
else if strings.HasSuffix(line, variable.SlowLogSQLSuffixStr) {
				// Get the sql string, and mark the start flag to false.
				err = st.setFieldValue(tz, variable.SlowLogQuerySQLStr, string(hack.Slice(line)))
判断SQL的后缀,进行处理。SlowLogSQLSuffixStr的定义如下:
const (
	// SlowLogRowPrefixStr is slow log row prefix.
	SlowLogRowPrefixStr = "# "
	// SlowLogSpaceMarkStr is slow log space mark.
	SlowLogSpaceMarkStr = ": "
	// SlowLogSQLSuffixStr is slow log suffix.
	SlowLogSQLSuffixStr = “;"
…
4.数据格式的转换
				if err != nil {
					return rows, err
				}
				rows = append(rows, st.convertToDatumRow())
				startFlag = false
			} else {
				startFlag = false
			}
		}
将经过SQL语句经过setFieldValue处理后,一段慢日志也就分析完了,下面是数据的转存储过程,将上面简单处理过的数据经过convertToDatumRow再次处理以满足slow_query的存储需求。同时将startFlag设置为false,以开始新的一段慢日志分析。
以上是慢日志处理的主要过程,下面将对其中涉及的两个主要函数setFieldValue和convertToDatumRow进行解读。
1.setFieldValue
功能是将解析的数据赋予对应的栏位,同时进行数据类型的转换,其中ParseTime将慢日志的时间进行兼容性解析。
func (st *slowQueryTuple) setFieldValue(tz *time.Location, field, value string) error {
	var err error
	switch field {
	case variable.SlowLogTimeStr:
		st.time, err = ParseTime(value)
		if err != nil {
			break
		}
		if st.time.Location() != tz {
			st.time = st.time.In(tz)
		}
	case variable.SlowLogTxnStartTSStr:
		st.txnStartTs, err = strconv.ParseUint(value, 10, 64)
	case variable.SlowLogUserStr:
		fields := strings.SplitN(value, "@", 2)
		if len(field) > 0 {
			st.user = fields[0]
		}
		if len(field) > 1 {
			st.host = fields[1]
		}
	case variable.SlowLogConnIDStr:
		st.connID, err = strconv.ParseUint(value, 10, 64)
	case variable.SlowLogQueryTimeStr:
		st.queryTime, err = strconv.ParseFloat(value, 64)
	case execdetails.ProcessTimeStr:
		st.processTime, err = strconv.ParseFloat(value, 64)
	case execdetails.WaitTimeStr:
		st.waitTime, err = strconv.ParseFloat(value, 64)
	case execdetails.BackoffTimeStr:
		st.backOffTime, err = strconv.ParseFloat(value, 64)
	case execdetails.RequestCountStr:
		st.requestCount, err = strconv.ParseUint(value, 10, 64)
	case execdetails.TotalKeysStr:
		st.totalKeys, err = strconv.ParseUint(value, 10, 64)
	case execdetails.ProcessKeysStr:
		st.processKeys, err = strconv.ParseUint(value, 10, 64)
	case variable.SlowLogDBStr:
		st.db = value
	case variable.SlowLogIndexNamesStr:
		st.indexIDs = value
	case variable.SlowLogIsInternalStr:
		st.isInternal = value == "true"
	case variable.SlowLogDigestStr:
		st.digest = value
	case variable.SlowLogStatsInfoStr:
		st.statsInfo = value
	case variable.SlowLogCopProcAvg:
		st.avgProcessTime, err = strconv.ParseFloat(value, 64)
	case variable.SlowLogCopProcP90:
		st.p90ProcessTime, err = strconv.ParseFloat(value, 64)
	case variable.SlowLogCopProcMax:
		st.maxProcessTime, err = strconv.ParseFloat(value, 64)
	case variable.SlowLogCopProcAddr:
		st.maxProcessAddress = value
	case variable.SlowLogCopWaitAvg:
		st.avgWaitTime, err = strconv.ParseFloat(value, 64)
	case variable.SlowLogCopWaitP90:
		st.p90WaitTime, err = strconv.ParseFloat(value, 64)
	case variable.SlowLogCopWaitMax:
		st.maxWaitTime, err = strconv.ParseFloat(value, 64)
	case variable.SlowLogCopWaitAddr:
		st.maxWaitAddress = value
	case variable.SlowLogMemMax:
		st.memMax, err = strconv.ParseInt(value, 10, 64)
	case variable.SlowLogSucc:
		st.succ, err = strconv.ParseBool(value)
	case variable.SlowLogPlan:
		st.plan = value
	case variable.SlowLogQuerySQLStr:
		st.sql = value
	}
	if err != nil {
		return errors.Wrap(err, "parse slow log failed `"+field+"` error")
	}
	return nil
}
2.convertToDatumRow
功能是将赋值后的数据进行类型转换已满足定义需求,同时使用parsePlan将执行计划进行解析以便更方便存储。
func (st *slowQueryTuple) convertToDatumRow() []types.Datum {
	record := make([]types.Datum, 0, len(slowQueryCols))
	record = append(record, types.NewTimeDatum(types.Time{
		Time: types.FromGoTime(st.time),
		Type: mysql.TypeDatetime,
		Fsp:  types.MaxFsp,
	}))
	record = append(record, types.NewUintDatum(st.txnStartTs))
	record = append(record, types.NewStringDatum(st.user))
	record = append(record, types.NewStringDatum(st.host))
	record = append(record, types.NewUintDatum(st.connID))
	record = append(record, types.NewFloat64Datum(st.queryTime))
	record = append(record, types.NewFloat64Datum(st.processTime))
	record = append(record, types.NewFloat64Datum(st.waitTime))
	record = append(record, types.NewFloat64Datum(st.backOffTime))
	record = append(record, types.NewUintDatum(st.requestCount))
	record = append(record, types.NewUintDatum(st.totalKeys))
	record = append(record, types.NewUintDatum(st.processKeys))
	record = append(record, types.NewStringDatum(st.db))
	record = append(record, types.NewStringDatum(st.indexIDs))
	record = append(record, types.NewDatum(st.isInternal))
	record = append(record, types.NewStringDatum(st.digest))
	record = append(record, types.NewStringDatum(st.statsInfo))
	record = append(record, types.NewFloat64Datum(st.avgProcessTime))
	record = append(record, types.NewFloat64Datum(st.p90ProcessTime))
	record = append(record, types.NewFloat64Datum(st.maxProcessTime))
	record = append(record, types.NewStringDatum(st.maxProcessAddress))
	record = append(record, types.NewFloat64Datum(st.avgWaitTime))
	record = append(record, types.NewFloat64Datum(st.p90WaitTime))
	record = append(record, types.NewFloat64Datum(st.maxWaitTime))
	record = append(record, types.NewStringDatum(st.maxWaitAddress))
	record = append(record, types.NewIntDatum(st.memMax))
	if st.succ {
		record = append(record, types.NewIntDatum(1))
	} else {
		record = append(record, types.NewIntDatum(0))
	}
	record = append(record, types.NewStringDatum(parsePlan(st.plan)))
	record = append(record, types.NewStringDatum(st.prevStmt))
	record = append(record, types.NewStringDatum(st.sql))
	return record
}
定位问题语句的方法(官方推荐)
并不是所有 SLOW_QUERY 的语句都是有问题的。会造成集群整体压力增大的,是那些 process_time 很大的语句。wait_time 很大,但 process_time 很小的语句通常不是问题语句,是因为被问题语句阻塞,在执行队列等待造成的响应时间过长。
admin show slow 命令
除了获取 TiDB 日志,还有一种定位慢查询的方式是通过 admin show slow SQL 命令:
admin show slow recent N;
admin show slow top [internal | all] N;
recent N 会显示最近的 N 条慢查询记录,例如:
admin show slow recent 10;
top N 则显示最近一段时间(大约几天)内,最慢的查询记录。如果指定 internal 选项,则返回查询系统内部 SQL 的慢查询记录;如果指定 all 选项,返回系统内部和用户 SQL 汇总以后的慢查询记录;默认只返回用户 SQL 中的慢查询记录。
admin show slow top 3;
admin show slow top internal 3;
admin show slow top all 5;
由于内存限制,保留的慢查询记录的条数是有限的。当命令查询的 N 大于记录条数时,返回的结果记录条数会小于 N 。
输出内容详细说明,如下:
| 列名 | 描述 |
|---|---|
| start | SQL 语句执行开始时间 |
| duration | SQL 语句执行持续时间 |
| details | 执行语句的详细信息 |
| succ | SQL 语句执行是否成功,1: 成功,0: 失败 |
| conn_id | session 连接 ID |
| transcation_ts | 事务提交的 commit ts |
| user | 执行该语句的用户名 |
| db | 执行该 SQL 涉及到 database |
| table_ids | 执行该 SQL 涉及到表的 ID |
| index_ids | 执行该 SQL 涉及到索引 ID |
| internal | 表示为 TiDB 内部的 SQL 语句 |
| digest | 表示 SQL 语句的指纹 |
| sql | 执行的 SQL 语句 |
定位问题语句的方法(个人经验)
虽然官方提供了简便的定位慢查询的方法,但因其保留时间短,不便于后续的慢日志的追踪和预警。因此建议大家可以基于上述的慢日志解析原理,构建自己的慢日志系统和工具。下图是常见的慢日志分析系统架构:
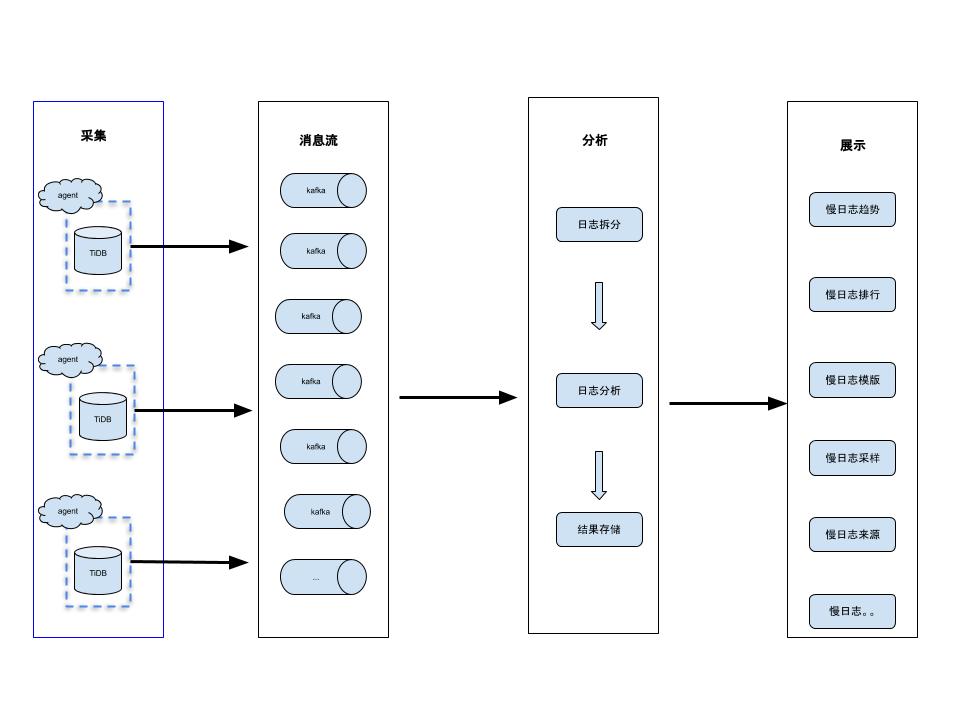
包含采集、消息流、分析、展示四大模块。其中采集模块一般是使用filebeat,当然也可以采用其他的方案,建议将对应的宿主机IP和Port信息一起采集;消息流模块一般使用kafka;分析模块就可以基于官方的源码进行魔改,如果在采集时包含了IP+Port可以在这一步结合元数据系统进行数据的进一步规整和区分;展示模块中最简单的方案就是基于es+kibana,至于其他的需要结合实际的使用场景要规划,如Prometheus提供的一套解决方案。
以上是抛砖引玉,欢迎大家吐槽。