

0. 问题
(1)非 root 用户 SSH 互信模式部署
# 1. 在中控机(tidb用户)生成公钥(id_rsa.pub),并配置互信:
ssh-keygen -t rsa
# 各个目标机:
vim .ssh/authorized_keys 或 ssh-copy-id -i ~/.ssh/id_rsa.pub <ip>
# 2. 配置sudo免密码
visudo

tidb ALL=(ALL) NOPASSWD: ALL
# 3. 通过 id_rsa(私钥) 访问各个目标机(authorized_keys/id_rsa.pub,公钥认证)部署:
tiup cluster deploy <clusterName> v4.0.0-rc ./topology.yaml -i ~/.ssh/id_rsa
~/.ssh/id_rsa 和 ~/.ssh/id_rsa.pub
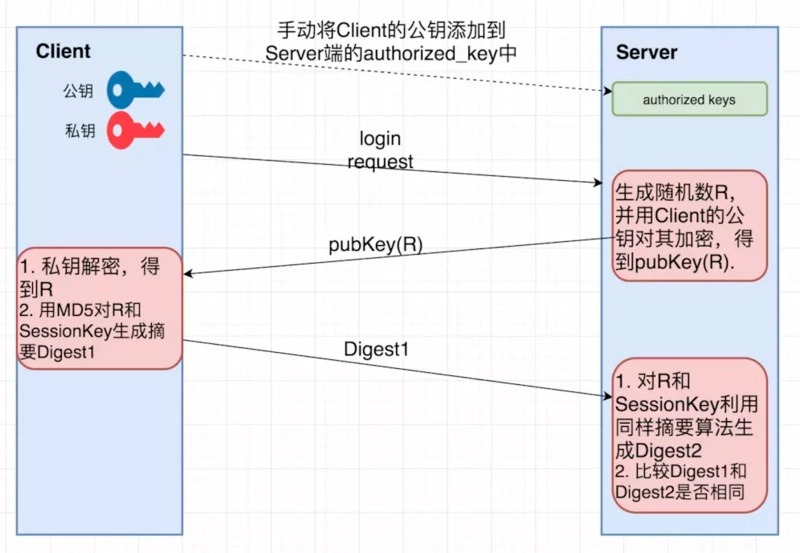
附加个 SSH 互信的原理(https://segmentfault.com/a/1190000018330563?utm_medium=referral&utm_source=tuicool)
(2)扩容 tidb-server 节点
# 测试环境,节点复用,改变端口
tidb_servers:
  - host: 10.0.100.3
    port: 4010
    status_port: 10090
    deploy_dir: "/data/tidb_4.0/deploy/tidb-4010"
    log_dir: "/data/tidb_4.0/deploy/tidb-4010/log"
# Scale Out
tiup cluster scale-out <clusterName> ./scaleout-topology.yaml -i ~/.ssh/id_rsa
(3)在扩容 tidb-server 后监控未自动添加问题(cluster v0.4.8 版本)
# 问题处理:
# 1. 升级 tiup cluster 版本
tiup update --all  或 tiup update cluster

# 2. 查看组件版本
tiup list

# 3. 重启 prometheus
tiup cluster restart bi-tidb -R prometheus
(4)TiDB dashboard 的“位置”问题:
a. 在实际环境中,只有一个 PD 节点提供 dashboard 服务,访问其他非服务节点会自动跳转;
# dashboard 非服务节点(PD)
$ curl -I 10.0.100.3:2389/dashboard/
HTTP/1.1 307 Temporary Redirect

# dashboard 服务节点(PD)
$ curl -I 10.0.101.2:2389/dashboard/
HTTP/1.1 200 OK
b. 目前还没有发现"内置的"查看 dashboard 服务节点的方式,还有其在 PD 集群中选择节点的规律也不太明了(在我的测试集群中 dashboard 服务节点,既不是 pd-leader,也不是 pd-1);
c. 对于一些有安全规范的公司,办公网和内网/生产环境是不直通的,所以这块如果需要通过ng访问访问内网服务(dashboard)的话,配置时需稍加注意;
1. TiUP 目录结构:
$ tree .tiup/
.tiup/
├── bin
│   └── tiup
├── components
│   └── cluster
│       ├── v0.4.8
│       │   ├── cluster
│       │   └── templates
│       │       ├── config
│       │       │   ├── alertmanager.yml
│       │       │   ├── blackbox.yml
│       │       │   ├── dashboard.yml.tpl
│       │       │   ├── datasource.yml.tpl
│       │       │   ├── drainer.toml
│       │       │   ├── grafana.ini.tpl
│       │       │   ├── prometheus.yml.tpl
│       │       │   └── pump.toml
│       │       ├── scripts
│       │       │   ├── action.sh.tpl
│       │       │   ├── run_alertmanager.sh.tpl
│       │       │   ├── run_blackbox_exporter.sh.tpl
│       │       │   ├── run_drainer.sh.tpl
│       │       │   ├── run_grafana.sh.tpl
│       │       │   ├── run_node_exporter.sh.tpl
│       │       │   ├── run_pd_scale.sh.tpl
│       │       │   ├── run_pd.sh.tpl
│       │       │   ├── run_prometheus.sh.tpl
│       │       │   ├── run_pump.sh.tpl
│       │       │   ├── run_tidb.sh.tpl
│       │       │   ├── run_tiflash.sh.tpl
│       │       │   └── run_tikv.sh.tpl
│       │       └── systemd
│       │           └── system.service.tpl
│       └── v0.4.9 (新升级)
│           ├── cluster
│           └── templates
│               ├── config
│               │   ├── alertmanager.yml
│               │   ├── blackbox.yml
│               │   ├── dashboard.yml.tpl
│               │   ├── datasource.yml.tpl
│               │   ├── drainer.toml
│               │   ├── grafana.ini.tpl
│               │   ├── prometheus.yml.tpl
│               │   └── pump.toml
│               ├── scripts
│               │   ├── action.sh.tpl
│               │   ├── run_alertmanager.sh.tpl
│               │   ├── run_blackbox_exporter.sh.tpl
│               │   ├── run_drainer.sh.tpl
│               │   ├── run_grafana.sh.tpl
│               │   ├── run_node_exporter.sh.tpl
│               │   ├── run_pd_scale.sh.tpl
│               │   ├── run_pd.sh.tpl
│               │   ├── run_prometheus.sh.tpl
│               │   ├── run_pump.sh.tpl
│               │   ├── run_tidb.sh.tpl
│               │   ├── run_tiflash.sh.tpl
│               │   └── run_tikv.sh.tpl
│               └── systemd
│                   └── system.service.tpl
├── data
├── manifest
│   ├── tiup-component-cluster.index
│   └── tiup-manifest.index
├── storage
│   └── cluster
│       ├── audit
│       │   ├── 4BB8RW
│       │   ├── ......
│       │   └── 4ByzCp
│       ├── clusters
│       │   └── bi-tidb
│       │       ├── config
│       │       │   ├── alertmanager-10.0.100.7-9093.service
│       │       │   ├── alertmanager_10.0.100.7.yml
│       │       │   ├── blackbox_10.0.100.3.yaml
│       │       │   ├── blackbox_10.0.101.4.yaml
│       │       │   ├── blackbox_10.0.100.7.yaml
│       │       │   ├── blackbox_10.0.100.1.yaml
│       │       │   ├── blackbox_10.0.100.5.yaml
│       │       │   ├── blackbox_10.0.101.6.yaml
│       │       │   ├── blackbox_10.0.101.2.yaml
│       │       │   ├── blackbox_exporter-9116.service
│       │       │   ├── dashboard_10.0.100.7.yml
│       │       │   ├── datasource_10.0.100.7.yml
│       │       │   ├── grafana-10.0.100.7-3000.service
│       │       │   ├── grafana_10.0.100.7.ini
│       │       │   ├── node_exporter-9101.service
│       │       │   ├── pd-10.0.100.3-2389.service
│       │       │   ├── pd-10.0.100.3-2389.toml
│       │       │   ├── pd-10.0.100.1-2389.service
│       │       │   ├── pd-10.0.100.1-2389.toml
│       │       │   ├── pd-10.0.101.2-2389.service
│       │       │   ├── pd-10.0.101.2-2389.toml
│       │       │   ├── prometheus-10.0.100.7-9090.service
│       │       │   ├── run_alertmanager_10.0.100.7_9093.sh
│       │       │   ├── run_blackbox_exporter_10.0.100.3.sh
│       │       │   ├── run_blackbox_exporter_10.0.101.4.sh
│       │       │   ├── run_blackbox_exporter_10.0.100.7.sh
│       │       │   ├── run_blackbox_exporter_10.0.100.1.sh
│       │       │   ├── run_blackbox_exporter_10.0.100.5.sh
│       │       │   ├── run_blackbox_exporter_10.0.101.6.sh
│       │       │   ├── run_blackbox_exporter_10.0.101.2.sh
│       │       │   ├── run_grafana_10.0.100.7_3000.sh
│       │       │   ├── run_node_exporter_10.0.100.3.sh
│       │       │   ├── run_node_exporter_10.0.101.4.sh
│       │       │   ├── run_node_exporter_10.0.100.7.sh
│       │       │   ├── run_node_exporter_10.0.100.1.sh
│       │       │   ├── run_node_exporter_10.0.100.5.sh
│       │       │   ├── run_node_exporter_10.0.101.6.sh
│       │       │   ├── run_node_exporter_10.0.101.2.sh
│       │       │   ├── run_pd_10.0.100.3.sh
│       │       │   ├── run_pd_10.0.100.1.sh
│       │       │   ├── run_pd_10.0.101.2.sh
│       │       │   ├── run_prometheus_10.0.100.7_9090.sh
│       │       │   ├── run_tidb_10.0.100.3_4010.sh
│       │       │   ├── run_tidb_10.0.100.1_4000.sh
│       │       │   ├── run_tidb_10.0.101.2_4000.sh
│       │       │   ├── run_tiflash_10.0.100.7_9000.sh
│       │       │   ├── run_tikv_10.0.101.4_20160.sh
│       │       │   ├── run_tikv_10.0.100.5_20160.sh
│       │       │   ├── run_tikv_10.0.101.6_20160.sh
│       │       │   ├── tidb-10.0.100.3-4010.service
│       │       │   ├── tidb-10.0.100.3-4010.toml
│       │       │   ├── tidb-10.0.100.1-4000.service
│       │       │   ├── tidb-10.0.100.1-4000.toml
│       │       │   ├── tidb-10.0.101.2-4000.service
│       │       │   ├── tidb-10.0.101.2-4000.toml
│       │       │   ├── tiflash-10.0.100.7-9000.service
│       │       │   ├── tiflash-10.0.100.7-9000.toml
│       │       │   ├── tiflash-learner-10.0.100.7-9000.toml
│       │       │   ├── tikv-10.0.101.4-20160.service
│       │       │   ├── tikv-10.0.101.4-20160.toml
│       │       │   ├── tikv_10.0.100.7.yml
│       │       │   ├── tikv-10.0.100.5-20160.service
│       │       │   ├── tikv-10.0.100.5-20160.toml
│       │       │   ├── tikv-10.0.101.6-20160.service
│       │       │   └── tikv-10.0.101.6-20160.toml
│       │       ├── meta.yaml
│       │       └── ssh
│       │           ├── id_rsa
│       │           └── id_rsa.pub
│       └── packages
│           ├── alertmanager-v0.17.0-linux-amd64.tar.gz
│           ├── blackbox_exporter-v0.12.0-linux-amd64.tar.gz
│           ├── grafana-v4.0.0-rc-linux-amd64.tar.gz
│           ├── node_exporter-v0.17.0-linux-amd64.tar.gz
│           ├── pd-v4.0.0-rc-linux-amd64.tar.gz
│           ├── prometheus-v4.0.0-rc-linux-amd64.tar.gz
│           ├── tidb-v4.0.0-rc-linux-amd64.tar.gz
│           ├── tiflash-v4.0.0-rc-linux-amd64.tar.gz
│           └── tikv-v4.0.0-rc-linux-amd64.tar.gz
├── tiup-cluster-debug-2020-04-13-21-47-54.log
├── ......
├── tiup-cluster-debug-2020-04-17-10-36-39.log
├── topology.yaml
└── scaleout-topology.yaml
2. TiUP 管理的组件(ctl 类工具安装):
$ tiup list
Available components (Last Modified: 2020-02-27T15:20:35+08:00):
Name               Installed           Platforms                 Description
----               ---------           ---------                 -----------
tidb                                   darwin/amd64,linux/amd64  TiDB is an open source distributed HTAP database compatible with the MySQL protocol
tikv                                   darwin/amd64,linux/amd64  Distributed transactional key-value database, originally created to complement TiDB
pd                 YES(v4.0.0-rc)      darwin/amd64,linux/amd64  PD is the abbreviation for Placement Driver. It is used to manage and schedule the TiKV cluster
playground                             darwin/amd64,linux/amd64  Bootstrap a local TiDB cluster
client                                 darwin/amd64,linux/amd64  A simple mysql client to connect TiDB
prometheus                             darwin/amd64,linux/amd64  The Prometheus monitoring system and time series database.
package                                darwin/amd64,linux/amd64  A toolbox to package tiup component
grafana                                darwin/amd64,linux/amd64  Grafana is the open source analytics & monitoring solution for every database
alertmanager                           darwin/amd64,linux/amd64  Prometheus alertmanager
blackbox_exporter                      darwin/amd64,linux/amd64  Blackbox prober exporter
node_exporter                          darwin/amd64,linux/amd64  Exporter for machine metrics
pushgateway                            darwin/amd64,linux/amd64  Push acceptor for ephemeral and batch jobs
drainer                                darwin/amd64,linux/amd64  The drainer componet of TiDB binlog service
pump                                   darwin/amd64,linux/amd64  The pump componet of TiDB binlog service
cluster            YES(v0.4.8,v0.4.9)  darwin/amd64,linux/amd64  Deploy a TiDB cluster for production
mirrors                                darwin/amd64,linux/amd64  Build a local mirrors and download all selected components
bench                                  darwin/amd64,linux/amd64  Benchmark database with different workloads
book                                   darwin/amd64,linux/amd64  A book about the TiDB ecosystem
doc                                    darwin/amd64,linux/amd64  Online document for TiDB
tidb-ctl                               darwin/amd64,linux/amd64
tikv-ctl                               darwin/amd64,linux/amd64
pd-ctl                                 darwin/amd64,linux/amd64
binlog-ctl                             darwin/amd64,linux/amd64
ctl                                    darwin/amd64,linux/amd64

$ tiup install pd-ctl
download https://tiup-mirrors.pingcap.com/pd-ctl-v4.0.0-rc-linux-amd64.tar.gz:
13466555 / 13466555 [-----------------------------------------------------------------------------------------------------------------------------------] 100.00% 9751385 p/s

$ find / -name "pd-ctl"
/home/tidb/.tiup/components/pd-ctl
/home/tidb/.tiup/components/pd-ctl/v4.0.0-rc/pd-ctl

$ ./pd-ctl store -u http://10.0.100.1:2389